All Montanans want a state of which we can be proud, one where our children can learn, grow, prosper, and stay to raise their own families. That future depends on our ability to invest in the public structures that educate our children, keep our communities safe, protect our land and water, and provide health care and other services for Montanans struggling to make ends meet.
Montana deserves a sensible approach to our revenue challenges that looks both at how budget cuts hurt families and communities and at how common sense revenue reforms will generate the resources we need to sustain our state.
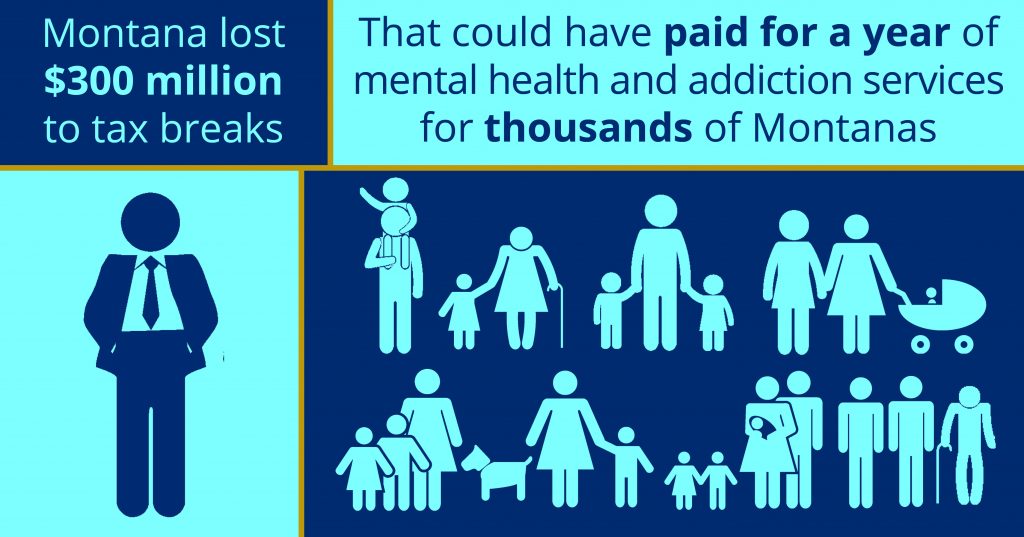
Each session, the Legislature is tasked with balancing the state budget. One solution for maintaining our investments in education, health care, and other public services is to scrutinize tax expenditures to determine if any are obsolete, ineffective, or need to be updated to reflect the current economy. Tax expenditures are tax breaks that, just like appropriations, cost the state millions of dollars in revenue every year. In the last full year with available data, Montana lost around $300 million, which amounted to 12 percent of the state’s general fund revenue in fiscal year 2018. These resources could have funded an entire year of operations of the Addiction and Mental Disorders division in the Department of Public Health and Human Services,[1] helping thousands of Montanans each year. As the Legislature looks to maintain investments in the things that protect and strengthen communities such as affordable housing, schools, and public health, they should consider eliminating inefficient and costly tax breaks.
What are Tax Expenditures?
Tax expenditures are often described as ‘‘silent spending.’’ They come in the form of preferences such as tax deductions, exemptions, deferrals, exclusions, credits, or lower tax rates given to individuals or businesses. Tax expenditures are a form of spending because they allocate funds for specific public purposes, although not through direct appropriations.
They have a significant impact on state revenue as they reduce or eliminate revenue that would have otherwise been collected. These expenditures are commonly referred to as incentives. Tax exemptions are not inherently good or bad policy. However, just like other state spending, evaluating them on a regular basis is a strategy for making sure that public resources can have the biggest impact.
Tax Expenditures in Montana
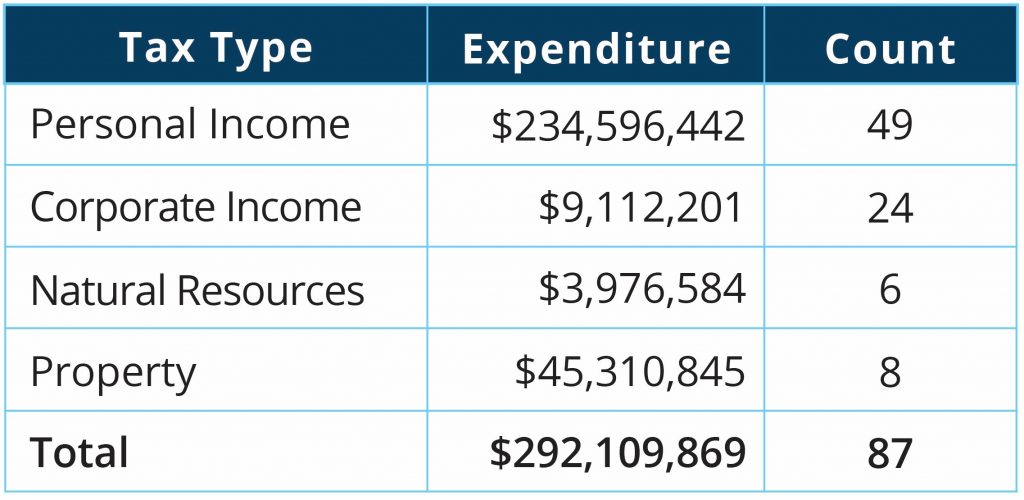
In Montana, all the major tax types have tax expenditures. The table below details the amount by the type of tax. Personal income tax expenditures account for 80 percent of the state’s tax expenditures.
One of the largest individual income tax expenditures is the capital gains tax credit, which cost the state over $48 million in 2017. This tax preference allows investors to pay a lower tax rate on income from investments than other types of income.
 The largest corporate income tax expenditure is the water’s edge election, which cost the state around $10 million in 2016. The water’s edge election allows multinational corporations to avoid paying taxes on profits they shifted overseas while our main street businesses have to pay taxes on all of their earnings.
One of the largest property tax exemptions is the intangible personal property exemption, which cost the state over $15 million in 2018 and resulted in a tax shift of $80 million of taxes to other taxpayers, increasing taxes on homeowners and small businesses. This provision allows some of Montana’s biggest corporations to avoid paying property taxes on some types of property.
Tax Credits
A tax credit is one type of tax expenditure. A tax credit is an amount of money that taxpayers can subtract from taxes owed. Because a tax credit directly reduces total taxes owed, this type of tax exemption can be costly to the state in lost revenue. It is often difficult for states to estimate the future cost of tax credits, and tax credits enacted without caps can often cost far more than projected.[2] The capital gains tax credit, for example, was estimated to cost the state about $8 million a year, but it actually cost the state $16 million when it was fully phased in in 2005 and has increased to cost the state almost $48 million in 2017.[3]
Tax credits can be structured to be refundable or nonrefundable. With a refundable credit, if the credit reduces the tax bill by more than the taxpayer owes, they can receive a refund. However, a nonrefundable credit can only reduce taxes owed to zero. Because of this, nonrefundable credits are much less beneficial to families living on low- and middle-incomes than families with high-incomes. Tax credits that are structured to be nonrefundable, meaning a taxpayer must earn enough to owe income tax in order to take the credit, are of little use to working families with less income tax liability (but likely paying other types of taxes, such as payroll, property, and excise taxes). In 2017, 62.4 percent of income tax credits claimed by residents went to households making over $204,501 in annual income.[4]
The table at the end of the report shows all individual income and corporate income tax credits.
Deductions, Exemptions, Exclusions, and other Tax Preferences
In addition to tax credits, tax expenditures come in the form of special treatment for types of income through exemptions or exclusions from taxable income, itemized deductions, and lower tax rates for certain types of income. Some of these tax expenditures are a result of following the federal law and tying to federal adjusted gross income, but states can choose to stop complying with provisions in the federal tax code. Other tax expenditures are a result of decisions the state Legislature makes with regard to what types of income should receive preferential tax treatment.
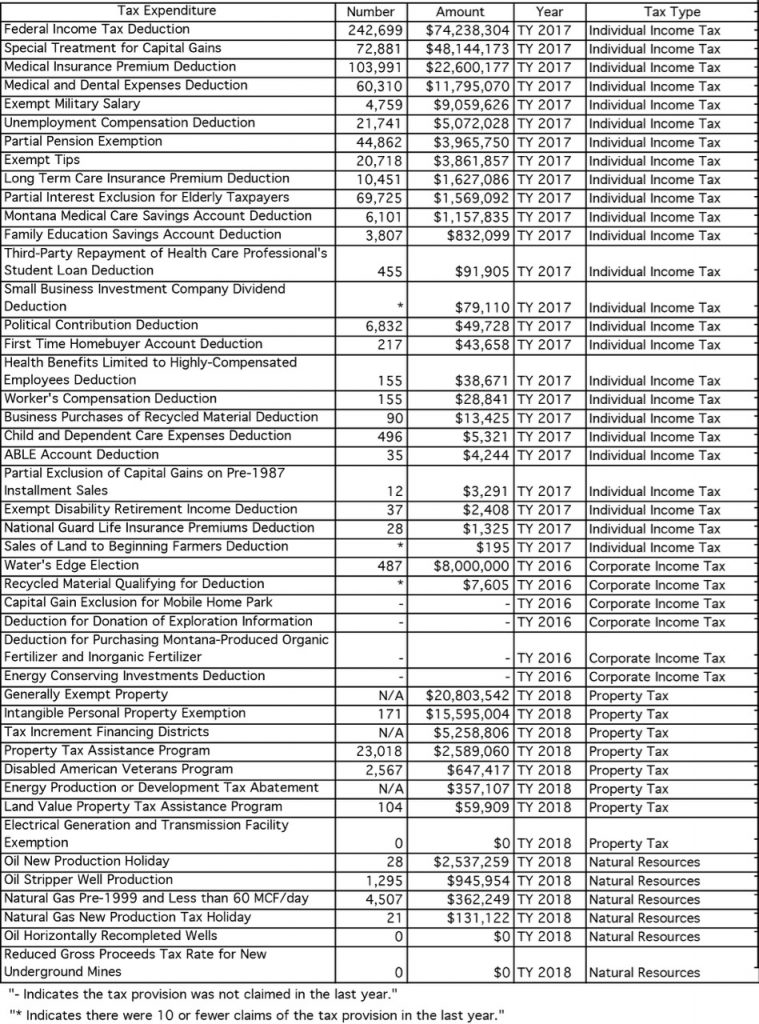
Over half (58 percent) of personal income tax expenditures and 88 percent of corporate income tax expenditures in the past year were deductions, exemptions, exclusions, or other tax preferences. Table 2 (page 5,6) shows all deductions, exemptions, and exclusions for the last full complete year, by tax type.
A Model for Tax Expenditure Reporting
House Bill 723, passed by the 2019 Legislature, asks the Revenue Interim Committee to review all tax credits over the course of the next 10 years. While HB 723 is a step in the right direction of providing accountability for these revenue reducers, it includes only tax credits, and does not provide sunset dates for each credit, reducing the incentive for the Legislature to conduct a thorough review.
The first step in evaluating tax expenditures is the creation of a report that allows policymakers to analyze how much tax expenditures are costing the state, who is benefiting, and which expenditures are serving their purpose.
A high-quality state tax expenditure report should be:[5]
Our state is one of 44 (including the District of Columbia) that produce a tax expenditure report. Montana’s report includes most of the elements mentioned above. However, improvements could be made by listing the rationale for each expenditure and projecting future costs of expenditures.
Currently, the Montana Department of Revenue’s tax expenditure report is one of the most thorough in the nation, but many of the components of the report are voluntarily included by the Department.[6] Policymakers could ensure the ongoing production of this useful information by requiring that the report and its current components be created each biennium
Recommendations for Informed Decisions on Tax Expenditures
To make decisions about the state budget more accountable and transparent, tax expenditures must face the same scrutiny that other state spending faces. In addition to the tax expenditure report, policymakers could improve accountability in this area by:
Conclusion
State spending in virtually every other area is held under a microscope every legislative session. Having these public discussions about state spending adds to the transparency and accountability of our democratic system. HB 723 is a good start to evaluating tax credits, but it is not enough. For the state to be accountable to its residents, all tax expenditures should automatically sunset on a rolling basis and thoroughly evaluated.
Table 1. Individual Income and Corporate Income Tax Credits
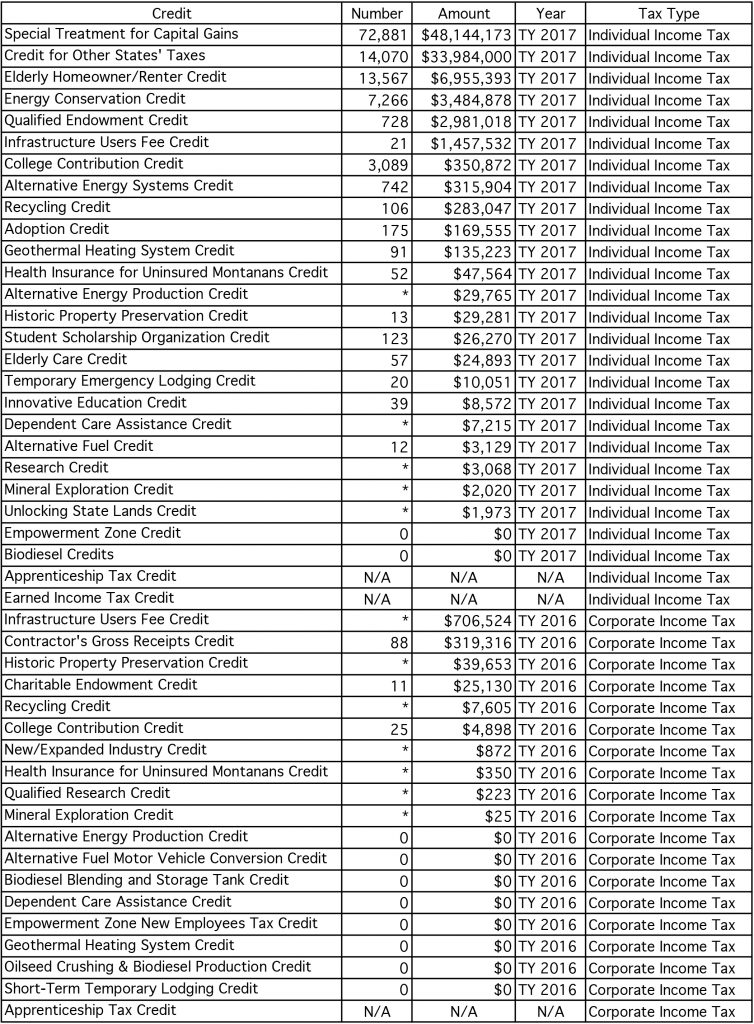
Table 2. Tax Exemptions, Exclusions, Deductions, and Other Tax Preferences
MBPC is a nonprofit organization focused on providing credible and timely research and analysis on budget, tax, and economic issues that impact low- and moderate-income Montana families.